Learn more about Location Based Network Simulators and their need in 5G deployments.
Introduction
A simulation is a key tool for modeling complicated systems, particularly where traditional analysis methods are unavailable owing to the sophistication of the modeling assumptions. Decision-makers may use simulations to create numerous circumstances and assess the impact of multiple pre-options on the performance of the system (Campanile et al., 2020). Network performance might degrade throughout a traffic increase. Consider viewing a live sports event at a packed arena, where internet traffic is likely to spike. The addition of base stations is frequently used to deal with this influx. Simulators that enable multi-user or multi-cell service have advanced to the point where they may now be often used to simulate some characteristics of actual networks (Graser, Straub, and Dragaschnig, 2013). This blog article will demonstrate how well a simulation may help to optimize the efficiency of your networks and find the best placement for a new base station.

What is Network Optimization and How Does It Work?
Network optimization is a combination of techniques and practices aimed at improving a network’s general health. It manages all components, from the client to the servers, as well as their operations and interconnections. Network optimization allows the user to monitor certain system performance such as data consumption, reliability, network congestion, lag, and oscillation. It provides them with critical information so that they may make the appropriate adjustments (Izquierdo-Zaragoza and Pavon-Marino, 2013). The objective of system optimization is not to purchase additional expensive firmware assets, but to make the most of what customers currently have. Two typical optimisation strategies that can assist enhance the efficiency of these measurements in data and voice systems are Traffic Engineering (TE) and Quality of Service (QoS).
An overview of the data used in the Simulation process.
Performance Management (PM) Data is used along with numerous KPI (Key Performance Indicator) findings are also included. A KPI is a Meta end-user impression of networks. KPI data are commonly used to compare network performance and identify issue areas (Saino, Cocora, and Pavlou, 2013). PM data is used to extract the GPS coordinates of base stations/cells, which then can then be used to build a base station in a simulator.
Stimulator automation steps for Location Based Simulators
Simulating a genuine networking ecosystem necessitates several code updates and interactions between people (Rampfl, 2013). The steps of the entire simulation are as follows:-
- Choose a place for the simulation map.
- Make a CSV file containing the locations of the base stations.
- Make a CSV file containing user locations.
- Create a YAML file with scenario parameters
- To begin the simulation, run the command line script.
- The Overpass API is used.
- The map file has been translated to a simulator-readable format.
- Users and base stations are depicted as points on a map.
- Runs and results of simulation
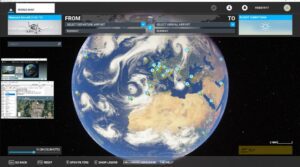
Choosing a stimulation map
An actual map might be made using the Overpass Turbo website. Overpass Turbo is an internet OSM data-gathering application that makes use of the Overpass API. Choose the map or the actual border with the Overpass API and search for all the things that should be inside the physical boundary (Wolski and Narciso, 2017).
A base station and user location deployment
The GPS coordinates of the base stations are extracted by using PM data and converted as a CSV file for base station placement (Coskun and Ayanoglu, 2014). The base stations are positioned centrally on the actual location, built by Overpass Turbo web-based service based on the GPS coordinates, using this CSV file as an entry to the simulation.
Creating high-traffic areas and hotspots for users
A map, assigned customers, and a base station are created, and now it is time for creating the data traffic. Simulators want to dramatically boost traffic in select locations compared to other regions for the practical example. This was accomplished by establishing borders inside a venue and boosting traffic inside those borders while maintaining normal traffic volumes in the nearby region.
YAML file parameters
The map generation described previously, as well as user and base station installation and traffic parameters, may all be submitted to the simulators through a YAML file. The base station GPS coordinates as a CSV file for base station placement is supplied. Maps may be produced just on run or from a YAML file given by the customer (Garaizar and Reips, 2013). The perimeter criteria and traffic volume parameters were used to manage traffic and define whether it should raise or reduce. Simulators only need to execute it once they have given values for all of the parameters (Campanile et al., 2020). It establishes the external conditions, installs clients and base stations, allocates data traffic, estimates user throughput, and saves the findings in the route supplied depending on the available settings.